This week, the euro and the dollar face off in a dynamic environment shaped by trade tensions, signs of economic slowdown, and conflicting expectations regarding interest rate direction.
With EUR/USD hovering around 1.12 after a technical rebound from early-May lows, markets are assessing whether the latest inflation and consumption data in the U.S., along with comments from Fed Chair Jerome Powell, will be enough to tip the balance toward a range breakout. Meanwhile, in Europe, the European Central Bank continues its dovish shift, and upcoming GDP and industrial production figures could offer clues about the eurozone’s resilience in the face of global protectionism.
This report analyzes the economic, technical, and political context surrounding the world’s most traded currency pair and outlines the potential scenarios traders should monitor in the coming days.
EUR/USD Fundamental Analysis 📈💶💵
In May 2025, EUR/USD is currently shaped by monetary policy divergence, growth differentials, and trade uncertainty in both the U.S. and the eurozone.
United States (USD):
The Federal Reserve has paused its rate cuts and maintains a cautious stance. Annual inflation slowed to 2.3% in April, slightly below expectations, easing inflation concerns and strengthening bets that the Fed could resume cutting rates later in 2025. The Fed recently left rates unchanged, noting it’s “in no rush” to raise them again as it assesses the impact of tariffs.
In terms of growth, the U.S. economy cooled significantly: preliminary estimates suggest 1Q GDP contracted slightly, attributed in part to trade disputes (companies front-loaded imports ahead of new tariffs, weighing on GDP).
Politically, the Trump administration has escalated trade protectionism, imposing 20% tariffs on European goods and sharply increasing tariffs on Chinese imports, which has triggered global uncertainty. However, a partial tariff truce with China announced in May — with mutual tariff reductions — has boosted risk appetite, weakened the dollar, and supported the euro.
Eurozone (EUR):
The eurozone economy showed initial resilience: 1Q GDP grew +0.4% QoQ, beating forecasts (+0.2%) and notably outperforming the U.S. in the same period. That said, this rebound may be short-lived, as the ongoing trade war threatens to impact exports and investment.
Inflation remains well-contained: for example, Germany’s annual CPI was around 2.1–2.2% in April, a multi-month low. Weakening inflation and growth prompted the ECB to resume stimulus, cutting its deposit rate to 2.25% in April (the seventh 25 bp cut in a year), declaring that inflation is now “essentially met” and that trade risks may further slow the economy. Several ECB officials hint at more cuts by summer, and markets expect a potential cut to 2.00% at the June 5 meeting.
In short, the fundamental backdrop pits a Fed on hold (with dovish bias) against a clearly accommodative ECB, while political uncertainty — especially around U.S. trade policy — remains a key factor for EUR/USD direction.
EUR/USD Technical Analysis 📊 (Daily Chart)
The EUR/USD daily chart suggests a consolidation phase following the recent correction, with well-defined support and resistance levels:
Recent trend: The pair dropped from a multi-year high near 1.1575 to a May low of ~1.1065, breaking the previous bullish streak and entering a short-term downward channel. However, recent sessions show a rebound from the 1.10–1.11 zone, with the pair now regaining ground toward 1.12, which now acts as immediate resistance.
Support & resistance: Key supports lie between 1.1100 and 1.1060, the latter aligning with the 50-day moving average, where the pair found a floor. A break below 1.1060 would confirm a new short-term low and expose the psychological 1.1000 level. To the upside, the 1.1250–1.1275 range is the most relevant short-term resistance; it includes recent highs and a descending trendline. A clean break above 1.1275 would signal a breakout and could extend gains toward 1.1400. Above that, 1.15 becomes a medium-term ceiling. Below 1.10, the next meaningful support lies at 1.0900 (year-to-date lows).
Indicators: Oscillators show moderate momentum. The RSI (14) sits near 50, suggesting neutral momentum. The MACD has flattened out, with no clear crossovers, reflecting loss of direction in the recent correction. This setup implies further consolidation is likely, pending a fundamental catalyst. Overall, the technical bias is indecisive to slightly neutral — a break above 1.1250 would revive bullish momentum, while a drop below 1.1060 would bring bearish pressure back into play.
Price Outlook for the Euro-dollar(1 Week and 1 Month) 🤔💭
1-Week Horizon: Analyst consensus favors range-bound trading around 1.12, unless a surprise catalyst emerges.
ING forecasts stabilization around 1.1200, with other banks like UOB Group suggesting recent momentum above 1.1225 signals consolidation, not a sustained breakout.
Most analysts see the pair stuck in a broader 1.10–1.15 range, reflecting offsetting forces from both central banks.
1-Month Horizon: Opinions are more varied.
Some analysts, like those at Danske Bank, expect EUR/USD to find buyers on dips, especially if U.S. economic data weakens further.
Societe Generale projects gradual euro gains, targeting 1.17 by year-end, implying upside in the next few weeks.
J.P. Morgan also maintains a bullish bias, seeing the uptrend intact as long as the pair stays above 1.1200.
Conversely, Commonwealth Bank of Australia (CBA) anticipates short-term USD strength, projecting a 2–3% bounce in the dollar index — which could pull EUR/USD down toward the lower 1.10s. Still, CBA acknowledges this would likely be temporary, and that U.S. trade policy missteps have “permanently damaged” the dollar’s haven status.
In summary, the 1-month outlook reflects balanced risks, with most forecasts centered around 1.12–1.13, barring new economic shocks or geopolitical developments.
Final Summary (For Short-Term Traders) 🎯
EUR/USD is at a key technical juncture, trading near the middle of a well-defined range. Key levels:
Upside: A break above 1.1250–1.1275 would signal strength, potentially extending the rally toward 1.1350–1.1400. This would likely require softer U.S. data (e.g., weak retail sales) or a dovish tone from Powell. Optimistic trade news could also boost the euro.
Downside: Failure to clear resistance, combined with strong U.S. data or hawkish Fed commentary, could see the pair fall back toward 1.1150, with a break below 1.1060 exposing 1.1000. Renewed geopolitical risk or tariff headlines could also support the dollar as a safe haven.
U.S. PPI and Powell Speech (Thursday) – Dovish Powell = USD ↓
Eurozone GDP (Thursday) – Positive surprise = EUR ↑
Consumer Sentiment (Friday) – Weak = USD ↓
Conclusion: EUR/USD is ready to move
EUR/USD is consolidating, awaiting a catalyst. Short-term traders should prepare for breakout scenarios above 1.1275 or below 1.1060. Stay agile, monitor key data, and use defined risk parameters. The pair is likely to remain volatile but range-bound unless something shifts the macro narrative decisively.
Grupo Aval Acciones y Valores S.A. is the largest financial conglomerate in Colombia and one of the banking leaders in Central America. Through its subsidiaries, it controls four Colombian banks — Banco de Bogotá, Banco de Occidente, Banco Popular, and Banco AV Villas — in addition to the pension fund administrator Porvenir and the financial corporation Corficolombiana.
It also has a significant international presence through BAC Credomatic, a banking group operating in six Central American countries. Combined, Grupo Aval offers a wide range of financial services (commercial banking, insurance, pensions, investments) to both public and private sector clients, with geographic strength concentrated in Colombia and the Central American region.
Fundamental Analysis
Grupo Aval posted a remarkable recovery in its results. In the first quarter of 2025, it reported a consolidated net income of COP 362 billion, a 217.8% increase compared to the same period the previous year (COP 113.7 billion). Even compared to the prior quarter, profits rose by 28%.
This strong rebound is partially due to extraordinary costs that affected 1Q2024 (e.g., new taxes on the financial sector), while 2025 shows a normalization of profitability. According to management, these results confirm a “recovery trend” and support projecting an ROE above 10% once again.
Revenue and Margins
Total revenues also increased, supported by a higher financial margin. Gross loan portfolio grew 5.4% year-over-year to COP 198.8 trillion as of 1Q2025. Despite the high interest rate environment in Colombia during 2023–2024, Aval managed to maintain a resilient net interest margin (NIM) and improve efficiency. The company highlights a “positive trend” in banking operations, with higher margins, better asset quality, and controlled operating costs.
Delinquency (NPL >90 days) reached 4.3% as of September 2024 (up from 3.8% a year earlier due to challenging conditions), but Fitch Ratings expects a slight improvement in 2025 as inflation falls and credit activity picks up. Provision coverage is sound at 125%, providing a buffer against defaults.
Profitability, Debt, and Solvency
For full-year 2024, Grupo Aval posted consolidated profits of COP 1.01 trillion, a +37.4% annual growth. This improvement occurred despite elevated provisioning costs in 2023–2024, reflecting the resilience of its financial business and stronger returns from non-banking investments (Corficolombiana’s infrastructure and energy assets contributed higher earnings).
The holding’s leverage is manageable: as of September 2024, its tangible capital-to-assets ratio was 8.6%, in line with historical averages, and expected to improve further with margin stabilization and lower funding costs. Holding-level financial debt totaled ~COP 5.8 trillion, but is well covered by cash and dividend flows from subsidiaries.
Fitch affirmed Aval’s international credit rating at BB+ (non-investment grade/high speculative), with a negative outlook (March 2025), citing Colombian macro risks despite Aval’s solid liquidity and debt servicing ability. S&P Global Ratings also maintained Aval at BB+ with a negative outlook (January 2024). These ratings indicate adequate solvency, but sensitive to domestic country risk.
Business Model Strengths
Grupo Aval maintains a leadership position in the local market, with about 25% market share in deposits and loans across the Colombian financial system. This gives it significant market power and a strong funding base (about two-thirds of its liabilities are low-cost deposits). Its diversified portfolio — universal banking, pensions, fiduciary services, leasing, and investments — allows for synergies and offsets underperformance in one segment with strengths in others.
For instance, in 2024, its pension subsidiary Porvenir managed ~46.9% of the country’s mandatory pension funds, generating stable fee income. Geographically, its presence via BAC Credomatic in Central America provides revenue in dollarized or differently cycled economies, reducing exclusive dependence on Colombia.
Historically, the Central American business has contributed a significant portion of Aval’s total assets and earnings — BAC has been seen as a growth engine and value generator.
Key Risks
Despite its strengths, Aval faces several challenges. In Colombia, economic growth has slowed amid high interest rates (Banco de la República’s policy rate hit 13.25% in 2023) and high inflation, which weigh on credit demand and borrowers’ repayment capacity. Although the situation appeared to bottom out in late 2023, there is still risk of asset deterioration in certain segments (unsecured consumer credit, SMEs), requiring elevated provisioning.
Political and regulatory risk is relevant: the current government implemented tax and pension reforms that directly impact the sector. The 2024 pension reform, effective July 2025, stipulates that contributions from workers earning up to 2 minimum wages will be directed to the public fund (Colpensiones), reducing flows to private funds like Porvenir. This could cut fee income from the pensions unit moving forward.
On the tax side, financial institutions now face surtaxes that increase the effective corporate tax burden, affecting comparative net income. In Central America, risks include potential currency devaluations or political instability in certain countries, though BAC operates mainly in relatively stable jurisdictions (Panama, Costa Rica).
Interest Rate Impact
The interest rate cycle is a double-edged sword. In 2022–2023, high rates boosted financial income (active interest) but also raised funding costs and delinquency. Looking ahead to 2025, a rate-cutting cycle is anticipated in Colombia (the central bank may lower rates if inflation moves closer to target).
This would benefit Aval via:
Lower funding costs (deposits and floating-rate bonds fall),
Increased credit demand as the economy reactivates, and
Reduced pressure on non-performing loans as financial burdens on clients ease.
Fitch projects that under this scenario, Aval’s consolidated operating ROA could return to 2.5–3%, compared to recent depressed levels (~2% or less). However, a steep rate cut could slightly compress NIMs in the medium term if lending rates fall faster than funding costs — Aval must therefore carefully manage its asset/liability duration gap.
Geographic Exposure – Colombia vs. Central America
Most of Aval’s assets, loans, and deposits are concentrated in Colombia, its main market. For instance, Banco de Bogotá — its largest banking subsidiary — holds about 83% of its loan portfolio in Colombia.
However, through BAC Credomatic, Aval maintains a significant presence in Panama, Costa Rica, Guatemala, and El Salvador. Prior to 2022, BAC represented nearly one-third of Banco de Bogotá’s operating earnings. In 2022, Grupo Aval distributed a majority stake in BAC Holding International to its shareholders, retaining an indirect minority stake. As a result, Central America is no longer fully consolidated into Aval’s financials but remains economically significant for shareholders.
In short, Colombia generates most of Aval’s current results, while Central America offers diversification and long-term growth potential. Any economic improvement in the region (e.g., recovery in Panama or Costa Rica) or strategic monetization of the remaining BAC stake would be an additional tailwind for the holding.
12-Month Price Targets for AVAL
Analyst consensus reflects moderate expectations for Aval. According to MarketScreener, the average 12-month price target is COP 620 per local share (~$3.10 USD per ADR), with a range from COP 600 to COP 640. This suggests limited upside (~+3%) from the current price (~COP 600), and a general recommendation of “Hold”.
International coverage of Aval is limited. J.P. Morgan and Scotiabank are among the few firms covering the stock. J.P. Morgan took a cautious view, downgrading Aval to Underweight after weak results in mid-2023, with a price target of COP 550 (~$2.75 USD per ADR), citing concerns about slow growth and Colombian political risk.
Scotiabank and other regional firms maintain more neutral stances, recognizing Aval’s franchise strength but also acknowledging the uncertainties.
While the consensus does not forecast a major rally in Aval’s stock over the next 12 months, these projections could be revised upward if macro conditions improve more than expected (e.g., faster rate cuts or favorable corporate developments).
A moderately aggressive investor should weigh the limited analyst upside against the potential for positive surprises if Aval exceeds earnings expectations or sentiment toward Colombia improves.
What’s Being Said About Grupo Aval – Rumors
A variety of rumors and market speculation have emerged around Grupo Aval’s potential corporate strategies:
Spin-off or sale of BAC Credomatic: There is anticipation that Aval may complete the separation of its Central American business, BAC Credomatic. In 2022, Aval already distributed ~75% of BAC’s shares to its shareholders. Now, it is rumored that the group could monetize the remainder through an IPO or a sale on NYSE.
Impact: Potentially positive, as a full spin-off could unlock value for shareholders (BAC is a valuable asset that could trade at higher multiples than currently reflected in AVAL’s valuation). However, it would reduce Aval’s geographic diversification, leaving it more Colombia-centric in the medium term.
Internal bank mergers within the group: Since Aval operates four commercial banks in Colombia, rumors periodically surface about potential internal consolidation — for example, merging Banco AV Villas with Banco de Bogotá or Banco de Occidente with Banco Popular. The goal would be to eliminate redundancies, cut operating costs, and gain efficiency through scale.
Impact: Could be positive in terms of cost savings and client base consolidation. However, banking mergers involve operational and regulatory risks (Superfinanciera approvals, system integration, possible layoffs). So far, Aval hasn’t announced anything concrete — it remains speculative.
Fintech alliances or digital banking ventures: Aval has reportedly been exploring strategic alliances with fintechs or in-house tech development to accelerate its digital transformation. It already launched initiatives such as the digital wallet “dale!” and Tags Aval, its instant payment platform, which reached 8.9 million users in 2025.
Impact: Generally positive, as greater digitalization improves competitiveness versus fintechs and digital-native banks. Partnerships with established fintechs could boost innovation and attract younger clients. Risks include execution costs and cultural integration. However, any bold fintech move by Aval would likely be well received by the market, showing adaptability.
Pension reform and insurance sector changes: While not strictly a rumor, it’s a structural factor. Colombia’s 2024 pension reform will affect Aval’s pension fund Porvenir. Analysts speculate that Aval may seek to reorganize, find partners, or even partially divest Porvenir to mitigate the impact. No confirmation exists.
Impact: Proactive moves (e.g., launching voluntary pension products or forming public-private partnerships) could soften revenue loss and be seen positively. Conversely, lack of action or weak results post-reform may pressure the stock (negative impact).
Possible ADR delisting from NYSE: Given AVAL’s low ADR price (< $3 USD) and modest trading volume, fears have emerged that the company could voluntarily delist from the NYSE to cut regulatory costs. Some Colombian issuers have taken that route in recent years.
Impact:Negative in the short term for the ADR, as international investors may rush to exit due to liquidity concerns. In the long term, it would reduce Aval’s global visibility. However, investors would still own local shares on Colombia’s BVC. The company has reaffirmed compliance with NYSE standards, but the rumor lingers as a source of uncertainty.
In summary, these rumors span from transformative corporate moves (spinning off BAC, bank mergers) to strategic responses to regulatory and tech shifts. For investors with a moderate-aggressive profile, many represent optional upside catalysts — not guaranteed, but valuable if realized. On the downside, items like a potential delisting could generate short-term volatility. The best course is to monitor official announcements and financial news closely.
Technical Analysis of AVAL Stock
So far in 2025, Grupo Aval’s ADR has staged a moderate recovery from lows, though it continues to move within a medium-term consolidation range. As of May 2025, the ADR trades near $2.80–$2.85, close to the midpoint of its 52-week range (low ~$1.94, high ~$3.32).
Key technical indicators:
Trend and Moving Averages: The short-term trend improved after the 1Q25 results. In early May, the stock rose ~5% and broke above its 50-day moving average (~$2.60). It is now nearing the 200-day average (~$2.90). A confirmed breakout above the 200 MA would signal a long-term bullish shift. NYSE trading volume is light (20k–80k shares/day), implying moderate liquidity and potential volatility.
Relative Strength Index (RSI): The 14-day RSI is currently in the neutral zone (50–60), after recovering from oversold levels in April. This suggests no extreme buying or selling pressure. The RSI supports a consolidation scenario: the stock may continue ranging while awaiting a new catalyst.
MACD (Moving Average Convergence Divergence): The MACD histogram turned negative in late February but has since shown convergence toward a bullish crossover. While no clear buy signal has emerged, momentum is improving. A crossover above the signal line later in May could strengthen the technical case.
Support and Resistance: On the Colombian BVC, PFAVAL has critical support around COP 560 (~$2.80 per ADR), aligning with current ADR prices. Holding above this level avoids downside breakouts. If it breaks below $2.70, the next support lies around COP 500 (~$2.50). Resistance is seen around COP 620–640 ($3.10–$3.20), where the stock peaked in November 2024 and analysts have set their consensus targets. A breakout above $3.20 would be technically significant, opening room toward $3.32 (annual high) or even $4.00, if supported by a strong fundamental catalyst.
Conclusion (Technical): Most indicators suggest a neutral-to-slightly-positive technical setup. There’s no strong “buy” signal yet, but also no red flags. For moderate-aggressive investors, this may be an opportunity to accumulate at support levels, with a stop-loss below $2.70, anticipating a breakout in the coming months if fundamentals improve.
12-Month Outlook for Grupo Aval – Scenarios
Grupo Aval’s 12-month outlook holds a slightly positive bias under the base-case scenario:
Base Case: Colombian macro stabilizes, inflation falls, and rate cuts begin gradually. Aval posts modest earnings growth, maintains a ~10% ROE, and offers ~5–6% dividend yield. Stock trades in a $2.80–$3.20 range. Analysts maintain Hold ratings.
Bullish Scenario: Faster-than-expected rate cuts, recovery in credit demand, and successful BAC monetization or merger news. Stock breaks above resistance levels, re-rates to $3.50–$4.00, delivering +20% to +30% total return including dividends.
Bearish Scenario: Policy missteps, recession, worsening credit quality, and adverse reforms (e.g., pensions). Profits decline, market sentiment deteriorates, and the stock revisits lows near $2.00. Dividend cuts are possible. Temporary loss of investor confidence.
Conclusion – A Moderately Aggressive Opportunity
Grupo Aval (AVAL) currently presents a moderately aggressive investment opportunity, where the potential upside comes with manageable risks. Its diversified business, earnings rebound, and potential macro tailwinds (lower rates) support the investment case.
The stock trades at modest multiples, offers stable dividends (~5%), and could see valuation expansion if strategic catalysts materialize (e.g., BAC monetization, digital transformation, merger efficiencies). Risks include Colombian policy shifts, execution challenges, and thin ADR liquidity.
For investors seeking emerging market financial exposure with structured upside optionality, AVAL offers a compelling setup — provided that positions are sized appropriately, with active monitoring of political and macro signals.
Why AVAL?
Undervalued financial leader in a large LatAm economy
Earnings recovery underway with macro normalization
Hidden value in assets like BAC, Porvenir, Corficolombiana
Dividend flow while waiting for re-rating
With patience and discipline, AVAL may reward investors who enter during this consolidation window and position for a 12-month revaluation based on improving fundamentals.
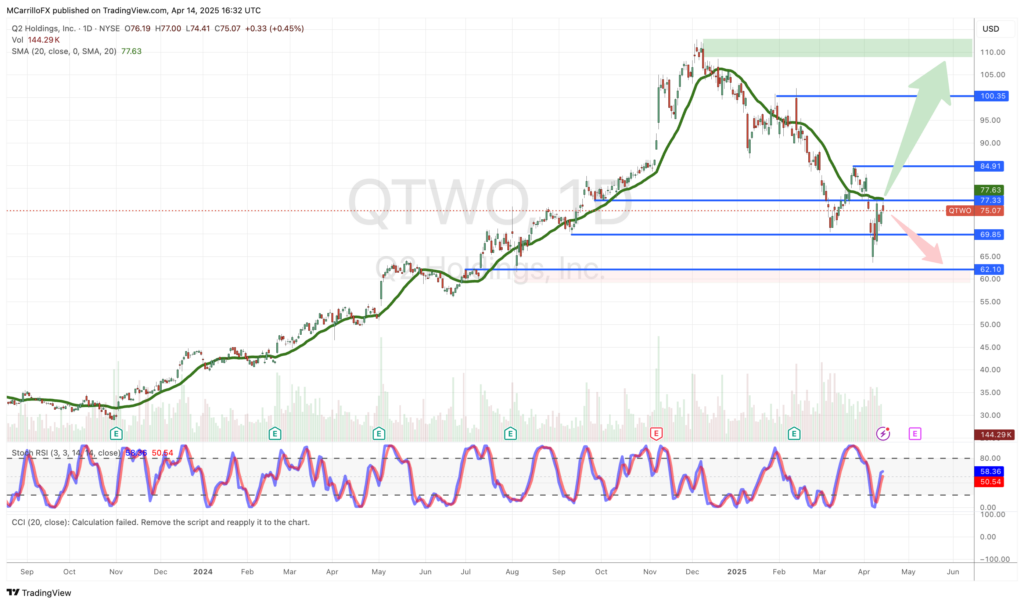
QTWO’s chart indicates a potential return to its all-time highs near $112 per share, representing a ~50% upside from the current prices. Fundamentals support this technical setup, reinforcing a compelling bullish case.
Q2 Holdings, a Texas-based digital banking platform, stands out as a resilient company with limited exposure to global tariff tensions—although it’s currently weighed down by general market sentiment.
Its robust business model, focused on recurring revenues and strong growth projections, further supports its investment appeal.
Mid-Term Rally in Sight
Q2 Holdings appears poised for a mid-term rally. Financial metrics, a return to profitability, and positive revenue expectations all point to upside potential. While the company operates in the tech sector, its limited international exposure—thanks to a largely domestic customer base and localized infrastructure—offers protection from the ongoing global trade frictions.
As an investor, I often focus on fundamentally sound companies operating in temporarily pressured sectors. Q2 Holdings fits this profile well.
Despite some short-term downside risks, the bullish outlook remains supported by analyst price targets and favorable technical patterns. Projections also suggest significant profitability and margin expansion over the next few years.
QTWO is currently trading within a range of $70 to $85. A breakout could first drive the stock toward $100, with the ultimate target being its all-time high of $112.
Q2 Holdings – The one-stop platform for all your financial needs
Current Price: $76 per share (April 2025)
Price Target: $112 per share (all-time highs)
Return Potential: +47%
Revenue Model: 90% recurring (SaaS)
Sector: Digital Banking / Financial Technology (BaaS)
Clients: 1,400+ financial institutions
Market Cap: $5 billion
Q2 Holdings is a Bank-as-a-Service (BaaS) provider delivering integrated financial solutions to banks, credit unions, AML service providers, payment gateways, microlending platforms, and small businesses.
The company acts as a bridge between traditional banking and modern digital solutions through a white-label SaaS platform. Key services include digital banking, payment processing, lending products, AML onboarding, and ACH-related tools.
Revenue is predominantly generated from cloud-based platform subscriptions. According to recent reports, Q2 serves over 1,400 institutional clients, many of whom utilize multiple products and modules.
Founded in 2004 in Austin, Texas, Q2 Holdings is now a sector leader with a growing footprint in financial technology.
QTWO Valuation and fair pricing
As of early April 2025, QTWO is trading at approximately $76 per share. Over the last 52 weeks, the stock has ranged between $50.22 and $112.82.
Forward P/E (2025, non-GAAP): 38–40
Trailing P/E (GAAP): Not applicable (2024 loss of $38.5M; EPS –$0.64)
Price-to-Sales: 7x (vs. 4.9x industry average)
The fair market value for QTWO is estimated to be around $80—close to its current price. However, strong investor interest in its recurring-revenue SaaS model, margin expansion, and growth trajectory suggests an upside beyond this level.
Price targets:
Goldman Sachs: $106
Morgan Stanley: $90
Fidelity: $110.90
Needham & Co: $125
S&P Global: $105
Stifel: $125
What do Q2 Holding earnings and profit projections look like for 2025 and 2026
SaaS model with high recurring revenue
Niche BaaS leader with low international exposure
Diversified and loyal client base
Steady growth through new clients and cross-selling
High future revenue visibility: $2.2B backlog (+21% YoY)
Q2 Holdings has been delivering steady growth with an 11.7% CAGR in the last three years, including a growth of 11.5% between 2023 and 2024. The growth has been fueled by new customer wins and cross-selling additional modules to existing clients. More importantly, a magic number of 90% of Q2 Holdings revenue comes from a subscription model, providing high visibility and stability.
Company metrics also suggest steady growth in the next quarters, as subscription revenue comprised the bulk of sales and grew 15% in 2024; and at the end of 2024, Annualized Recurring Revenue was $682M (+15% YoY) and committed backlog was $2.2B (+21% YoY).
The 2025 guidance is also full of momentum, as Q2 Holdings sees revenues between $772–$779 million, an 11-12% year-over-year increase. The company is fully focused on profitability as they guided for 2025 adjusted EBITDA of $165–$170M (21–22% EBITDA margin), up from $126M in 2024 (18% margin). Signaling significant margin expansion as revenue grows. By 2026, Q2 Holdings looks for an adjusted EBITDA margin of 24–25%, with a free cash flow conversion >85% of EBITDA.
Analysts also expect Q2 Holdings will turn the tables and pass from a -$0.64 loss per share in 2024 to a consensus EPS for FY2025 of $0.67 (GAAP). In other words, analysts expect that the company will maintain around a steady 10% annual revenue growth for the next few years. This would put 2026 revenue in the $850–900M range.
If this happens, 2026 EBITDA would exceed $250M with strong free cash flow, making the case for an EPS significantly above $1.00.
Investment case for QTWO
Strong technical potential: consolidation above key support ($70.27)
Solid fundamentals: revenue growth of over 11% annually
Return to profitability: 2025 EPS estimate: $0.67 vs -$0.64 (2024)
Bullish analyst outlook:
Goldman Sachs: $106
Fidelity: $110.90
Needham & Co / Stifel: $125
In the long-term perspective, Q2 Holdings presents an interesting case of a niche market leader in the banking as a services industry with a strong business model based on recurring revenue and growing profitability.
The revenue model is top class with around 90% of the company’s revenue being recurring due to its subscription-based services. This puts the company at the top of headlines and gives them a lot of presence in cross-vertical institutions. Also, as a niche market leader, it is becoming the standard for all institutions, their employees, and, obviously, their clients.
Q2 Holdings is surfing two of the hottest waves in the market, finance and technology. They are democratizing technology for finances and helping small and medium companies to modernize their platforms and services with no significant costs. So, the company is in the cornerstone of the technological and financial revolutions.
The board is fully focused on profitability and improving margins. After spending years in client acquisition and competitors and/or service purchases that resulted in operating losses, the company is shifting now to profitability, based on model business and moving to greater margins.
User and client retention: With over 1,400 institutional clients, Q2 Holdings is now working on making related services available to everybody. They are building a one-stop financial solution for all needs. So, rather than losing customers, they are adding more services to increase client loyalty and increase their invoices.
As mentioned before, Q2 Holdings is moving to consolidate its position as the standard of the BaaS in the United States, with small and medium clients in need of digital and online solutions, but also even Top Tier banks such as Wells Fargo.
However, major risks would come from external factors like recession or deteriorated market sentiment due to global tariff tensions.
Recession or tariff tensions can push a slowdown in bank tech spending or higher costs for the whole fintech sector. However as Q2 Holdings is mainly a provider of cloud-based digital banking solutions with a business model based on software, services and recurring subscriptions with mostly domestic customer base, the expected direct impact would be minimal.
Technical Perspective for Q2 Holdings
Key support: $70.27
Immediate resistance: $84.40
First target: $100
Final target: $112 (all-time highs)
Downside risk if $70 breaks: potential drop to $61.51 (-20%)
In the short term, QTWO is in a consolidation phase after the 145% rally performed in 2024. Share of Q2 Holding peaked at an all-time high of 112.82 on December 4, 2024, to its lowest level since September 2024 at $70.27 on March 10, 2025.
Now, QTWO is building up a rebound from a strong support at March 10 lows at the 70.27 area; If the stock breaks up above March 25 and 26 highs at 84.40, bullish potential can take the share to the 100.00 area first and then all-time highs at 112.00. Almost a 50% increase.
In the bearish scenario, if QTWO consolidates levels below the SMA20 periods, currently at 77.63, a visit to its 6-month low of 70.27 reached on March 10, which is an 8% decline from current levels. However, if the share breaks that level, a 20% decline from the current level is on the cards as the share would try to find a floor at the August 6 low of 61.51.